5.2.42. Prometheus (metrics scraper + TSDB)¶
1. Overview¶
Prometheus runs as three containers in the infra band: prometheus, node-exporter (host metrics) and cadvisor (cgroup-level container metrics). PROMETHEUS_SOURCE scales all three together. It is disabled by default.
Image: prom/prometheus:v2.55.1 (Apache 2.0). The bundled exporters are prom/node-exporter:v1.11.1 and gcr.io/cadvisor/cadvisor:v0.55.1. Default TSDB retention is 7 days. The wizard asks for it on the Prometheus source step.
The scrape config is static (services/prometheus/config/prometheus.yml) and lists every supported target in the stack. Targets of disabled services report up == 0; the file is not templated per enabled service. Recording / alert rules live under services/prometheus/config/rules/; the bundled stack-recording.yml is an empty placeholder.
1.1. cAdvisor isolation boundary¶
cAdvisor receives no Docker socket, Docker API proxy, host-root mount, or Docker data-directory mount. It reads only the host cgroup hierarchy through /sys, runs with a read-only root filesystem, all Linux capabilities dropped, and no-new-privileges. Docker discovery is explicitly pointed at a nonexistent socket and container-label storage is disabled.
This deliberately trades friendly Docker names and labels for isolation: container series are keyed by cgroup ID. Use Compose/Grafana context to correlate IDs when needed. Host CPU, memory, disk, and network names remain available from node-exporter.
2. Access¶
| Surface | URL | Auth |
|---|---|---|
| Prometheus UI + API (direct) | http://localhost:${PROMETHEUS_PORT} |
None |
| Prometheus UI + API (Kong) | http://prometheus.localhost:${KONG_HTTP_PORT} |
None. /-/quit and /-/reload return 403 here; the direct port still accepts them (see §7). |
| Direct (internal) | http://prometheus:9090 |
None — backend-network only |
| node-exporter (direct) | http://localhost:${NODE_EXPORTER_PORT}/metrics |
None |
| cAdvisor (direct) | http://localhost:${CADVISOR_PORT} |
None |
prometheus.localhost has no authentication. With the default HOST_BIND_IP=127.0.0.1:, Kong listens on loopback only; see §7 before exposing it further. Use Grafana as the user-facing dashboard surface.
3. Configuration¶
PROMETHEUS_SOURCE=disabled              # container | disabled
PROMETHEUS_RETENTION_DAYS=7             # 1..365
PROMETHEUS_PORT=                        # auto-assigned by topology (infra block)
NODE_EXPORTER_PORT=                     # auto-assigned
CADVISOR_PORT=                          # auto-assigned
Auto-managed (do not edit by hand):
PROMETHEUS_ENDPOINT=...                  # consumed by Grafana provisioning
PROMETHEUS_SCALE / NODE_EXPORTER_SCALE / CADVISOR_SCALE
POSTGRES_EXPORTER_SCALE / REDIS_EXPORTER_SCALE  # cross-manifest writes
./start.sh sets all five scale vars and PROMETHEUS_ENDPOINT from PROMETHEUS_SOURCE. The two *_EXPORTER_SCALE vars control the sidecars in services/supabase/ and services/redis/.
4. Scrape targets¶
15 targets ship in config/prometheus.yml:
| Job | Target | Notes |
|---|---|---|
prometheus |
prometheus:9090 |
Self-metrics |
grafana |
grafana:3000 |
Grafana self-metrics |
node |
node-exporter:9100 |
Host CPU/mem/disk/net |
cadvisor |
cadvisor:8080 |
Per-container resources |
kong |
kong-api-gateway:8100 |
Kong Status API + Prometheus plugin. (The Compose service name is kong-api-gateway; kong alone does not resolve on the backend-network.) |
litellm |
litellm:4000 |
Per-model tokens / cost / latency / errors (requires callbacks: [prometheus] in LiteLLM config) |
weaviate |
weaviate:2112 |
Requires PROMETHEUS_MONITORING_ENABLED=true on Weaviate |
n8n |
n8n:5678 |
Requires N8N_METRICS=true |
n8n-worker |
n8n-worker:5678 |
Queue mode runs executions worker-side — execution-data counters live here |
minio |
minio:9000/minio/v2/metrics/cluster |
Requires MINIO_PROMETHEUS_AUTH_TYPE=public |
backend |
backend:8000/metrics |
prometheus-fastapi-instrumentator middleware |
asset-worker |
asset-worker:8095 |
Auth-free operational metrics; asset mutation routes remain bearer-token protected |
asset-baker |
asset-baker:8096 |
Auth-free operational metrics; asset mutation routes remain bearer-token protected |
postgres-exporter |
postgres-exporter:9187 |
Sidecar embedded in Supabase family; scales 1↔0 with PROMETHEUS_SOURCE |
redis-exporter |
redis-exporter:9121 |
Sidecar embedded in Redis family; scales 1↔0 with PROMETHEUS_SOURCE |
Ollama is deliberately not scraped — LiteLLM is its gateway and emits per-call request/token/cost metrics, so scraping Ollama directly would duplicate that data. Container-level resource usage is covered by cAdvisor.
Not scraped: JupyterHub and Hermes. The JupyterHub image (quay.io/jupyter/datascience-notebook) runs a single-user server with no /metrics endpoint. The nousresearch/hermes-agent image has no /metrics endpoint either.
5. Dependencies & Integrations¶
5.1. Current — Upstream (this service calls)¶
| Service | Category |
|---|---|
| grafana ↔ | infra |
| kong ↔ | infra |
| minio | data |
| redis | data |
| supabase | data |
| weaviate | data |
| litellm | llm |
| asset-baker | media |
| asset-worker | media |
| n8n | agents |
| backend | apps |
5.2. Current — Downstream (services that call this)¶
| Service | Category |
|---|---|
| grafana ↔ | infra |
| kong ↔ | infra |
5.3. Architecture diagram¶
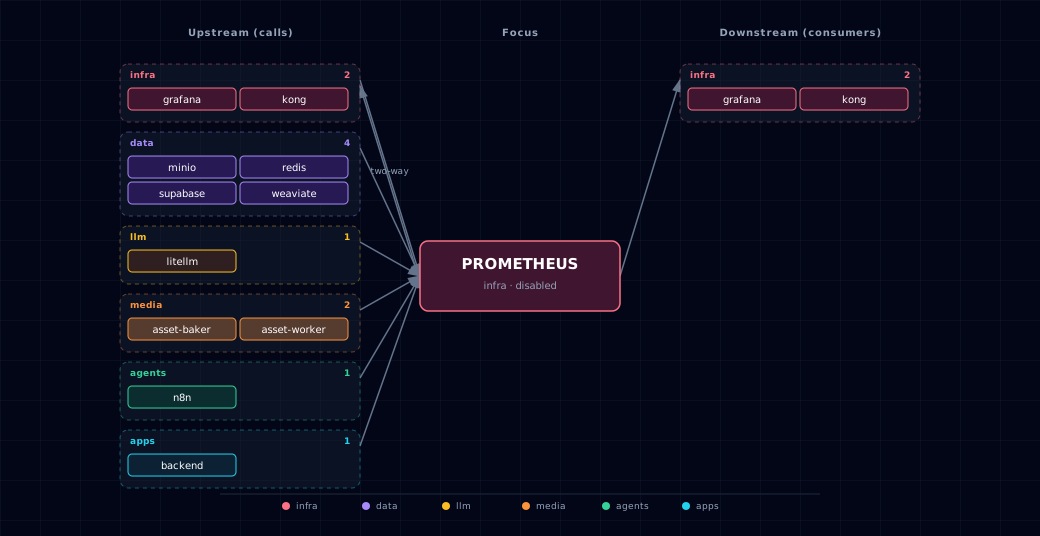
Open the full-size diagram for a full-screen view.
5.4. Future — Missing pair integrations¶
No high-confidence opportunities identified.
5.5. Future — Candidate new services¶
- Alertmanager — paging and routing for Prometheus alerting rules. The bundle uses Grafana's unified alerting. A separate Alertmanager matters only for clustered HA alerting.
5.6. Future — Unused features in this service¶
- Remote write to long-term storage —
remote_writeto Mimir / Thanos / VictoriaMetrics for retention beyond the local TSDB, when local disk limits retention. - Recording rules — pre-aggregated time series for expensive Grafana queries;
config/rules/stack-recording.ymlis an empty placeholder ready to be populated. - Native histograms — Prometheus 2.40+ supports native histograms. LiteLLM and the FastAPI instrumentators can emit them with a smaller storage footprint than classic histograms.
6. Troubleshooting¶
- Targets show
DOWNfor services that are running — the service probably has not enabled its/metricsendpoint. Check the per-service flag (N8N_METRICS=true,PROMETHEUS_MONITORING_ENABLED=true, …). Visithttp://prometheus.localhost:${KONG_HTTP_PORT}/targets(default port 63000) to see thelastErrorfor each failing job. - No metrics for postgres / redis — the sidecar exporters scale to 0 when
PROMETHEUS_SOURCE=disabled. ConfirmPROMETHEUS_SOURCE=containeris set in.envand re-run./start.sh. - Disk pressure —
prometheus-datanamed volume grows roughly linearly with retention × scrape rate × series count. LowerPROMETHEUS_RETENTION_DAYSor trim scrape jobs inconfig/prometheus.yml. - cAdvisor or node-exporter unable to start on macOS —
/procand host filesystem mounts behave differently inside Docker Desktop's VM than on Linux. Some node-exporter collectors degrade gracefully, and cAdvisor's container metrics are platform-agnostic. Host-level metrics on macOS are best-effort.
7. Capabilities & limitations¶
Support tier: experimental — Capability contract declared; no cited cold-start, workflow, or upgrade qualification run yet (evidence at v0.1.0).
| Capability | Status | Verification | Notes |
|---|---|---|---|
| Stack metrics scraping and local TSDB | supported | tested | Atlas ships a static fifteen-target scrape inventory, exporter lifecycle wiring, and configurable local Prometheus retention. |
| Host and container resource metrics | partial | tested | node-exporter and hardened cAdvisor provide resource series, but cAdvisor omits Docker labels and host collectors are best-effort under Docker Desktop. |
| Alert routing and long-term metrics storage | not-supported | documented | Atlas configures neither Alertmanager nor remote-write storage, and the shipped recording-rule file remains an empty placeholder. |
| Authenticated Prometheus and exporter access | not-supported | tested | The direct PROMETHEUS_PORT, NODE_EXPORTER_PORT, and CADVISOR_PORT publishes have no authentication. The CORS-only Kong prometheus.localhost route has no authentication. --web.enable-lifecycle is enabled. Kong answers 403 to /-/quit and /-/reload, but the direct port accepts them, so any web page can POST /-/quit and stop Prometheus. The default HOST_BIND_IP=127.0.0.1: keeps direct ports loopback-bound. Before wider exposure, firewall or remove the direct ports, and add an authentication proxy or remove the Prometheus Kong route. |